Keg volume over time
Not every beer goes equally fast
Transcript
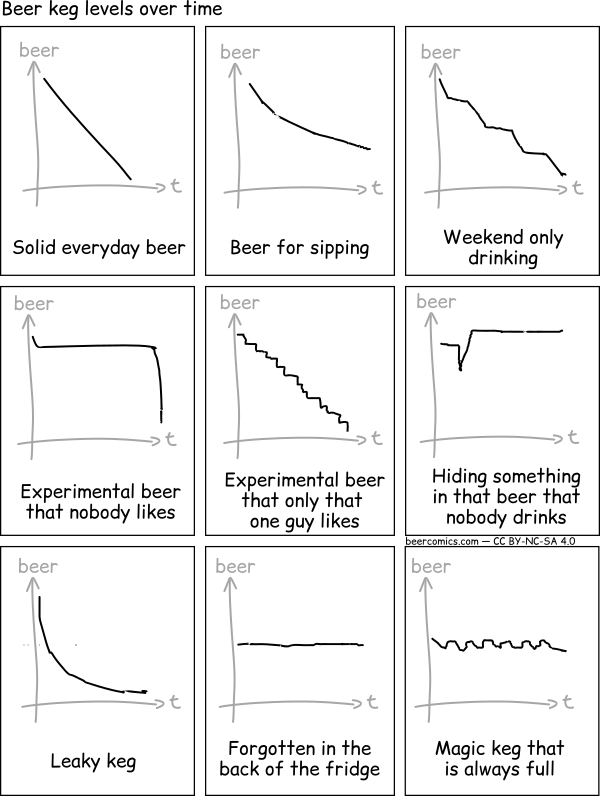
A series of diagrams show keg contents over time..
Beer keg levels over time
The first diagram shows a quick steady decline. Caption: Solid everyday beer
The second diagram shows first a quick decline, then the curve goes to a slower decline. Caption: Beer for sipping
The third diagram shows multiple steps of declines, each followed by no change in contents. Caption: Weekend only drinking
The fourth diagram shows a slow decline, then the curve stays flat at a high level, until it rapidly drops to zero. Caption: Experimental beer that nobody likes
The fifth diagram shows a curve like a staircase going down. Caption: Experimental beer that only that one guy likes
The sixth diagram shows a dip, then it raises above the initial level. Caption: Hiding something in that beer that nobody drinks
The seventh diagram shows a steep drop and then the curve converges on zero. Caption: Leaky keg
The eighth diagram shows a flat line at a high level. Caption: Forgotten in the back of the fridge
The last curve shows many decreases followed by increases, always keeping a high volume. Caption: Magic keg that is always full
Tags: keg
 https://beercomics.com/comics/keg-volume-over-time.html